Description
Non-destructive Asphalt Density Testing Equipment
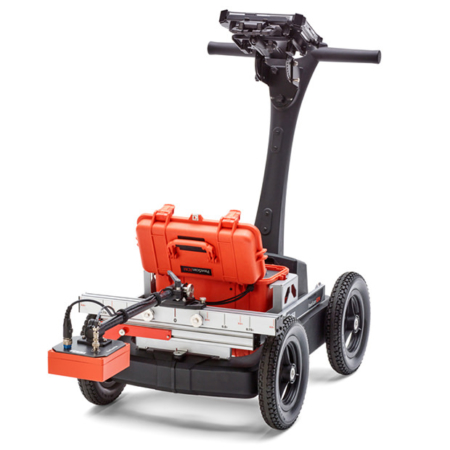
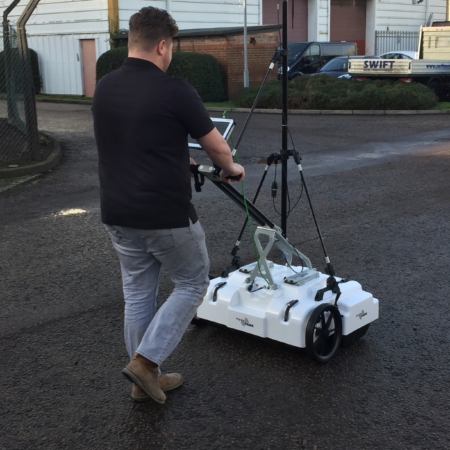
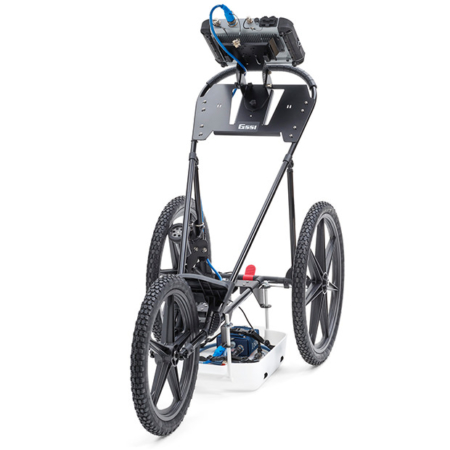
The PaveScan RDM is ideal for uncovering inconsistencies that occur during the paving process, including poor uniformity and significant variations in density. By detecting these problems, PaveScan RDM helps to avoid premature failures such as road ravelling, cracking and deterioration along joints.
| Max Depth | Surface Only |
| Sensor Frequency | 2 GHz |
| Weight | 32.2-36.7 kg (71-81 lbs) (cart dependent) |
| Storage Capacity | 128 GB |
| Data Display Modes | Line Graph and Data Contour Map |
| Accessories | Upgrade kit from 1 to 3 sensors |
Innovative Technology
PaveScan RDM offers an easy and affordable assessment tool to non-destructively determine asphalt dielectric during application. This system is ideal for uncovering inconsistencies that occur during the paving process, including poor uniformity and significant variations in density.
Typical Uses
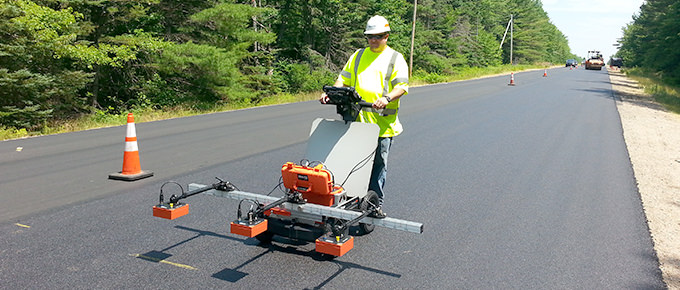
The PaveScan RDM is typically used for:
- Non-destructive asphalt compaction testing
- Quality assurance/quality control of new pavements
- Determining pavement non-conformity
Groundbreaking Solutions
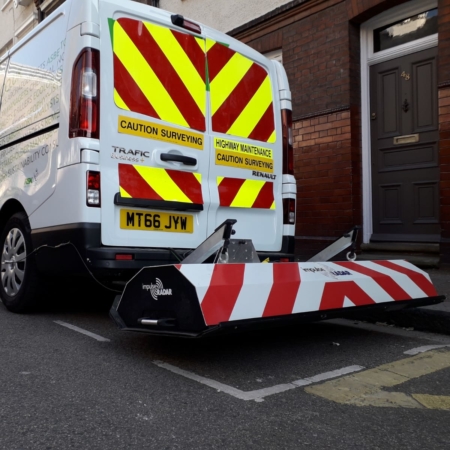
PaveScan RDM is the premier asphalt test method to identify areas of non-conformity in new pavement. It can be deployed with two different survey methods; utilising the dielectric values or percent voids. There are no site hazards or need to close off work areas as is the case with nuclear gauges/radioactive alternatives.
Data Visualisation
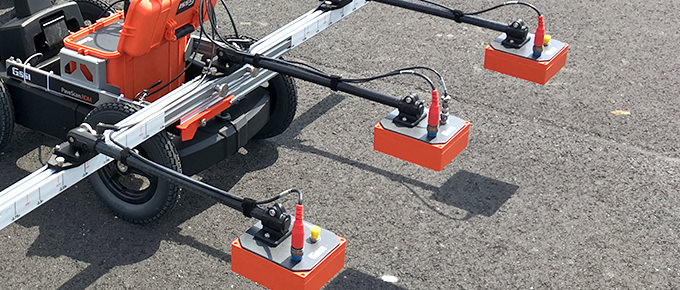
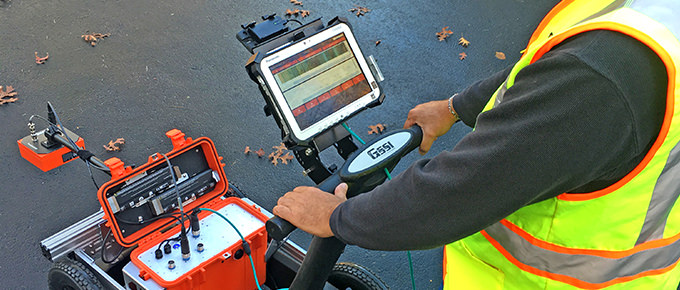
From technician to engineer, the PaveScan RDM is easy to operate. With seamless GPS integration, real-time onscreen data output, and export options, this system is ideal for government transportation agencies and paving contractors alike.
Data Examples
Single Sensor
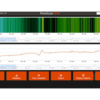
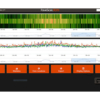
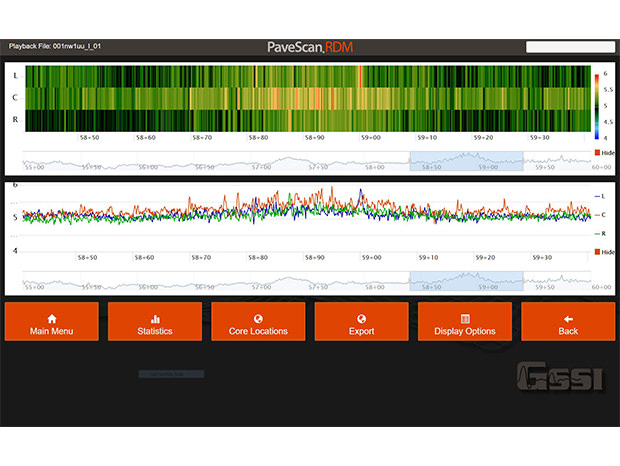
The colour map indicates anomalies in the dielectric measurement, allowing technicians to clearly identify areas of interest.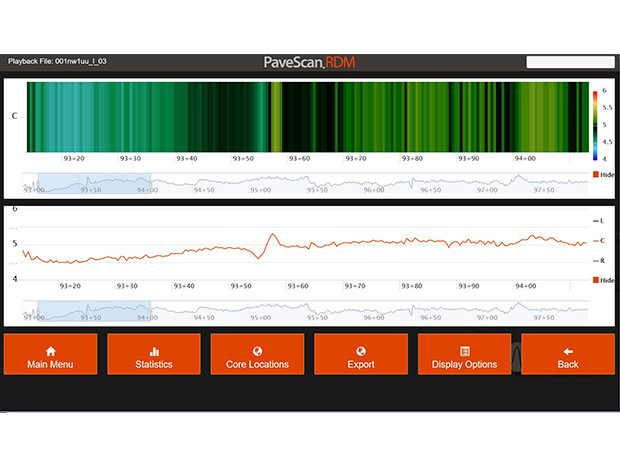
Three Sensor
The line chart illustrates a three-sensor system, each line represents the dielectric output of the sensor.
Google Earth Image
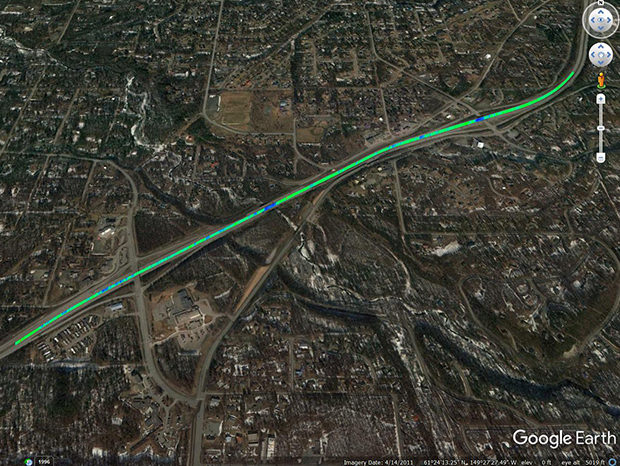
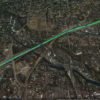
This data illustrates a Google Earth image that has been exported as a .kml file directly from the PaveScan RDM. This image is showing the density levels of newly laid compacted pavement. The blue areas are low density and the middle blue areas are bridges.
